
content
Switch off Facebook tomorrow. Chances are nothing will happen for a few weeks. Plenty of Google Ads vs Facebook Ads arguments start in exactly those weeks, because that is long enough to decide one of the channels was dead weight.
At Advantrise we run Google Ads services and Meta advertising for Australian businesses, so we look at both dashboards side by side. With both open at once, the weeks after a switch-off look very different from how they appear inside either one.
In a business where Facebook feeds search, it tends to go like this. In week 1 the Google reports look exactly as they did. Enquiries keep coming and cost per lead holds. In week 2 something dips slightly, easy enough to blame on the season. In week 3 searches for the brand name start sliding. By week 4 cost per lead in Google is climbing, and the channel that starred in last month’s report has suddenly “stopped working”.
The owner messages the Google specialist asking what broke. Nothing broke.
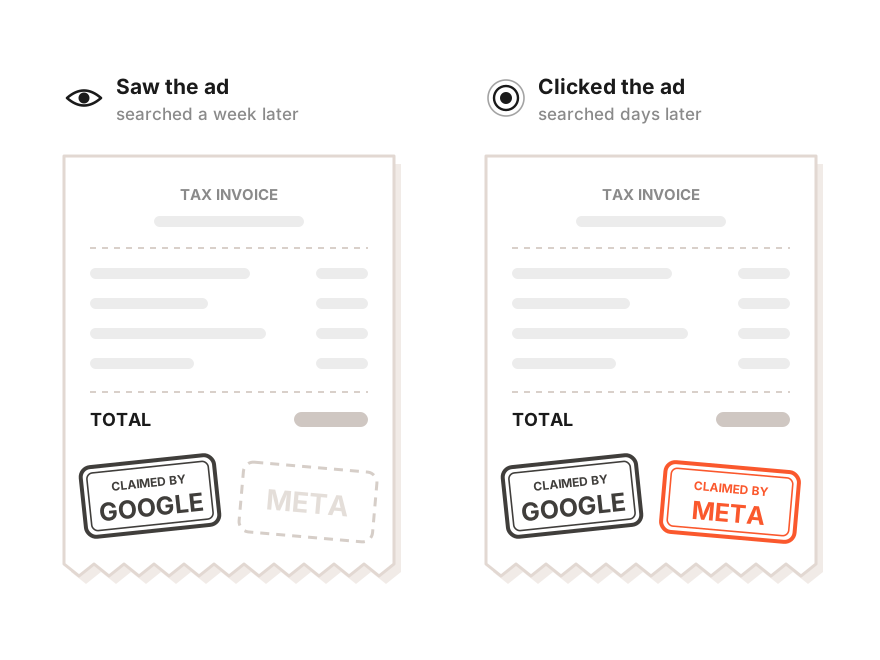
So what happened? For months Facebook had been feeding Google, and neither dashboard gave Facebook credit for most of it. Someone saw an ad on Instagram, did not click, remembered the name a week later, googled it and bought through a search ad. Google recorded the sale as its own. Facebook never saw it at all, because since January 2026 Meta credits a purchase after an ad view without a click for 1 day at most.
It works the other way too. Someone clicks an Instagram ad, looks around the site and leaves, then comes back through a search ad a few days later and buys. Now both dashboards record the sale, because by default Meta counts purchases for 7 days after a click.
Some customers Facebook brings in are never credited to Facebook in any report, and some get claimed by both platforms at once. Add the dashboards together and the total can sit well away from what the till shows.
Facebook Ads here means Meta’s whole advertising platform, which runs ads on Facebook and Instagram from the same account, so this article treats them as one.
The rest covers how each channel works, why comparing them on cost per click or per lead can mislead, which one suits which business, how to split the budget and when to run both. It also covers how to measure what each channel contributes without waiting for an accident to show you.
Searching and scrolling
Agencies hear this one regularly: “Facebook gives cheap leads, Google just burns money.” The first half matches the data. The second half does not, and believing it is how budgets end up in the wrong place.
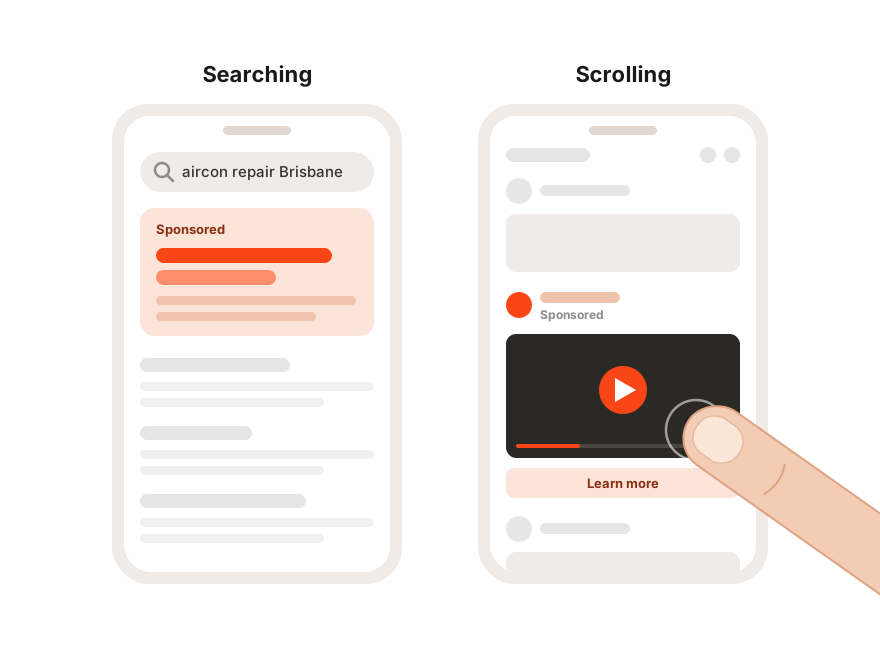
So what is the real difference between the channels? Google answers a question the person has already asked. They typed “aircon repair Brisbane”, and the ad meets them when the decision is nearly made. That is capturing demand that existed without you.
Facebook works with someone who was not looking for anything. They are scrolling past friends’ posts, and the ad has to stop their thumb, then earn their interest, then wait until they are ready to buy some day. That is creating demand that did not exist a minute ago.
Everything else follows from that. On Google the search does the heavy lifting, so an ad can be plain text and run for months. On Facebook the creative does, because over the past few years the algorithm has taken over most of Meta’s targeting, and the creative now shapes who sees the ad. The audience tires of the same video over time, so it needs replacing.
The line between them is blurring, for what it is worth. Google has long shown ads on YouTube and in the Discover feed, where people are not searching either. The basic logic still holds. Google catches the people who come looking, Facebook brings in the ones who were not planning to.
Google harvests, Facebook plants. Stop planting and there is still something to harvest for a while, and that delay is exactly what misleads people.
The table the comparison needs
| Google Ads (search) | Facebook Ads | |
|---|---|---|
| Cost per click | higher, several times the price | several times cheaper |
| Cost per lead | higher | roughly 60% lower (US data) |
| Audience | people searching right now, filtered by the query | broad, found by the algorithm through the creative |
| Formats | text ads, shopping ads, map listings | images, video, Reels, carousels, lead forms |
| Place in the funnel | bottom, ready to act | top and middle, not searching yet |
| What matters most | keyword accuracy and the landing page | fresh creative |
| Measurement | fairly direct | harder since iOS tracking limits |
The lead figures come from LocaliQ’s 2026 reports. A lead from a Facebook lead campaign cost US$27.39 on average, a lead from search ads US$66.69. In Australia, Facebook leads run about 10% above the global median, and we have not found a public Australian comparison of the platforms in the same units. Treat the US figures as a rough guide, since the exact ratio in your market will differ.
Plenty of comparisons stop there, and that is where they go wrong.
Cheap leads, expensive customers
If a Facebook lead costs 60% less, why not move the whole budget across?
Because a lead is not a customer yet. People who run both channels mostly agree that enquiries from search close more often. Someone who went looking for your service and someone who left a number while scrolling are different people with a different readiness to pay. How much more often depends on the industry and on how your forms are set up, so the only place to find your own figure is your CRM.
Lead forms show this most clearly. With a lead form, someone fills in an enquiry inside Facebook without ever visiting your site. It takes a few taps, because the details come pre-filled from their profile. That is why forms bring in noticeably more enquiries than sending people to a website, and also why more of them come from people who never meant to buy anything.
Try a hypothetical with round numbers. You spend $2,800 on each channel. Facebook brings 100 leads at $28, Google brings 40 at $70. On leads, Facebook wins easily. Now assume 10% of the Facebook leads become customers and 30% of the Google leads do. That is 10 customers against 12. Each Facebook customer cost $280, each Google customer $233. The winner swaps places as soon as you count in the right units.
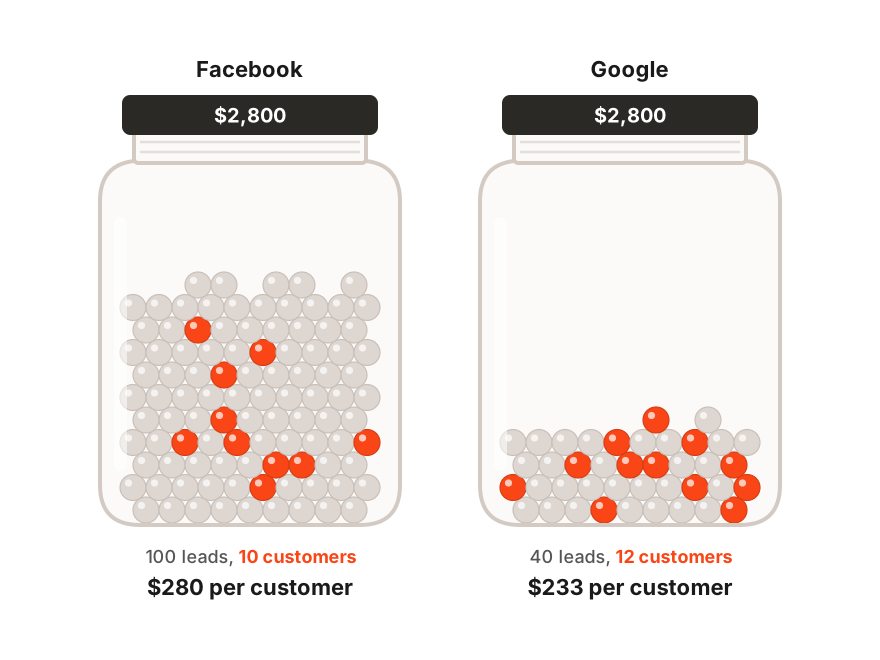
For impulse purchases Facebook can come out cheaper per customer as well, so Google does not always come out ahead. The example only shows how comparing on cost per lead can point you to the opposite of the right answer.
Count customers, not leads. If your CRM cannot show which channel each paying customer came from, fix that first and split the budget afterwards.
Which business suits which channel
Local services
Which comes first here? Almost always Google. Someone with a burst pipe is not going to wait for a plumber’s ad to turn up in their feed. They are searching right now. For emergency work Facebook is weak.
What about services where the decision takes weeks? A kitchen renovation, a beauty salon, a gym or cosmetic dentistry all run on different logic. Facebook is good at getting people in specific suburbs to remember your name, and Google catches them once they are ready to decide.
Online stores
Why do stores need both? Of the business types in this article, this is where the channels most often run side by side all year. Google takes people looking for a specific product, Facebook shows people products they did not know they wanted. Visual products like clothing, homewares and gifts do especially well on Facebook.
There are 2 Australian wrinkles. Since 10 December 2025 the country has barred under-16s from holding social media accounts, and the ban covers Facebook, Instagram and YouTube. Government figures put Instagram alone at around 350,000 Australians aged 13 to 15. For a store selling to teenagers that is a real loss of reach, mostly on Meta. On YouTube teens lost their accounts but can still watch without signing in.
The second wrinkle is automation. Meta’s own guidance says an ad set needs about 50 conversions in 7 days to exit the learning phase and deliver steadily. A small store making a handful of sales a week often never gets there, and the campaign stays uneven for a long time.
B2B
Google usually matters more here, because the decisions are made by people deliberately looking for a supplier. Facebook has a harder time in B2B. In 2025 Meta merged many narrow targeting categories into broad ones and cut the job title list down considerably. In automated campaigns those settings now work as a suggestion to the algorithm. On top of that, someone scrolling their feed is rarely thinking about buying industrial equipment.
That said, Facebook is still worth keeping. Showing ads to people who visited your site and left is relatively cheap on Facebook, and over a long sales cycle a reminder a month later can decide the deal.
How to split the budget
Where do you start when money is tight? With demand that already exists. If people search for what you sell, start with Google and cover every search worth paying for. Add Facebook afterwards to widen that demand.
If your product is new and nobody searches for it, the logic flips. There is nobody to catch on Google yet, so Facebook becomes the first channel.
Which Facebook cost is easiest to underestimate? Creative. Audiences tire of a video or a banner over time, and the cost of results climbs. So the Facebook budget comes with a standing need for new images and video. On Google a text ad can run for months unchanged.
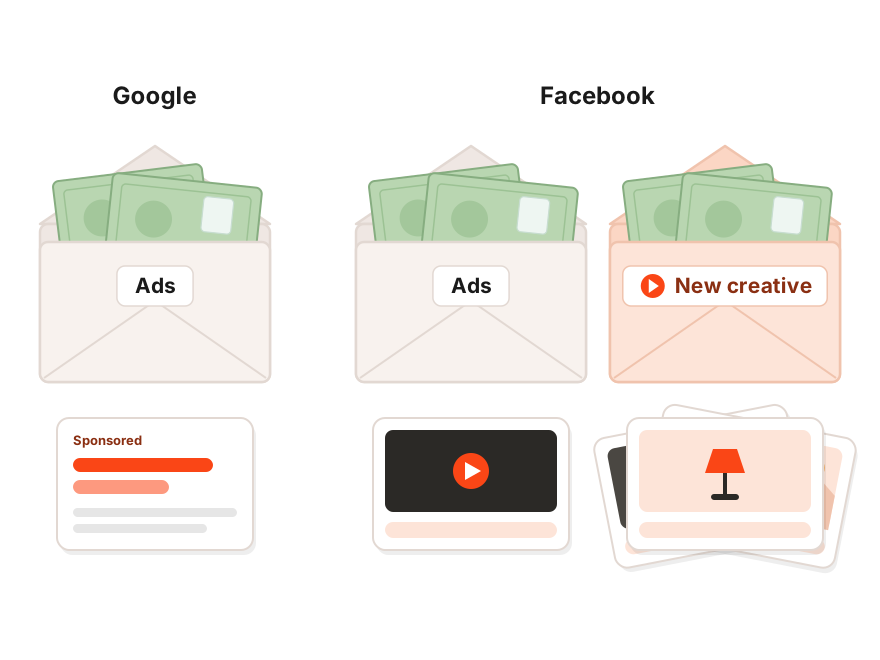
When you plan for Facebook, budget for a steady supply of new creative as well as for the ads themselves. Without it the channel gets more expensive month after month.
When to combine, and how to check
Go back to the experiment at the top. If Facebook feeds your brand searches on Google, switching off one channel hits both. That is why, for many businesses that can both create and capture demand, the channels together deliver more than either does alone. An experienced Facebook Ads agency builds Meta campaigns knowing part of the result will show up in someone else’s report.
So how do you find out what each one contributes, if neither dashboard can be taken at its word? With a switch-off test. For a few weeks, turn Facebook off in some regions, a few states for example, and leave it running everywhere else. Leave every other channel untouched during that time. Ignore the dashboards and watch total sales and brand searches. Before the test, note how the test regions track against the rest of the country. If they fall behind once Facebook is off, the size of that gap is roughly what the channel contributes.
This is usually where the objection comes: “Switching ads off means losing money on purpose.” Losing a little, yes. A few weeks of controlled loss usually costs less than a year of budget split on guesswork.
Be ready for an answer you do not like. Sometimes the test shows Facebook adds little or nothing, and sales hold steady without it. In that case cut it back, however good its dashboard looks.
Each platform’s dashboard shows the sales it takes credit for. Only a switch-off test shows what you would not have sold without it. Split the budget by the second number.
Google Ads vs Facebook Ads FAQ
Which is cheaper, Google Ads or Facebook Ads?
Facebook is cheaper per click and per lead, several times cheaper per click and roughly 60% cheaper per lead in US data. Per customer it depends on the industry, because leads from search usually close more often.
Which works better for a local business?
Google, for emergency work. For planned services where people take weeks to choose, the combination works well. Facebook makes your name familiar in the area, and Google catches people when they decide.
Do Facebook Ads work for B2B?
Less well than Google, because job title targeting on Meta has been limited since the 2025 changes. They do work well for showing ads again to people who have already visited your site.
How has the under-16 social media ban affected advertising?
For most businesses barely at all, since they do not target teenagers. Stores selling clothing, games or cosmetics to a young audience lose part of their reach on Facebook and Instagram. On YouTube, teens are still viewers, just without accounts.
How long should a switch-off test run?
Usually 3 to 6 weeks for the test itself, plus a few weeks of data beforehand to compare against. The fewer sales you make each week, the longer it takes for the difference to stand out from random noise. Keep in mind that a short test struggles to pick up brand effects, which build over months.
What a business is really paying for
What a business pays an agency for is customers who would not have turned up without the ads. Clicks, CTR, cost per lead and the tests in this article are all attempts to count those customers, some more accurate than others.
At Advantrise we start with a free audit that lines up both dashboards against your real sales and shows where the reports claim the same customers. The decision after that is yours.
Subscribe to our newsletter